The Final Frontiers
Why mass unemployment didn’t happen yet - and why this time is really different

The Final Frontiers:
Why mass unemployment didn’t happen yet - and why this time is really different
Gert van Vugt · March 2026
If you want to look up your own job before reading the methodology, see the job explorer dashboard. Or play with the spider chart. The rest of this article explains what the numbers mean and why they look the way they do.

Every major technology displaced workers. And every time, commentators declared that while previous displacements turned out to be temporary, this time would be different — that widespread, permanent replacement was on the horizon. They were always wrong. Many professions did vanish — lamplighters, switchboard operators, elevator attendants — but the economy proved remarkably good at creating new jobs that nobody had imagined. The displaced moved on. The labor market adapted.
This pattern is so reliable that economists gave it a name: the lump of labor fallacy. The idea that there is a fixed amount of work to go around — and that a machine doing a task means a human can’t — turns out to be wrong whenever you examine it historically. Its close cousin is the Jevons paradox: when technology makes a resource cheaper to use, total demand for it tends to increase, not decrease. Coal-fired engines made energy cheaper, and the world used more energy, not less. Spreadsheets automated calculation, and companies hired more analysts, not fewer. Technology doesn’t just destroy jobs. It lowers costs, expands demand, creates entirely new industries, and generates work that didn’t previously exist. The total amount of work isn’t fixed — it grows with the economy.
The fallacy has held for so long that invoking it has become a kind of argument-ender. Someone warns about AI and unemployment; someone else vaguely utters “lump of labor fallacy” or “Jevon’s Paradox”; and the conversation moves on.
But the fallacy depends on a condition that is easy to overlook: it requires that displaced workers have somewhere to go. Every previous wave of automation satisfied this condition in two ways. First, technologies were narrow — a power loom conquered weaving, but the weaver’s Manual Dexterity was still valuable in hundreds of other jobs. The skill survived even when the specific application didn’t. Second, when entire skill categories were mechanized, adjacent categories remained open — machines replaced muscle, but humans still had cognition; computers replaced calculation, but humans still had judgment and communication. There was always an escape route, either to a new use for the same skill or to a different skill entirely.
The question that matters now is not whether AI is impressive, or whether it will displace workers in specific roles. It will, and in many cases it already has. The question is whether the condition still holds: is there still a large frontier of skills where humans have a decisive advantage? Is the escape route still open?
This paper measures that frontier directly — using the largest standardized skill taxonomy available, assessed against dozens of AI benchmarks across 87 distinct human abilities and skills, at three points in time. The answer is that the frontier is not shrinking gradually. It is collapsing. And for a growing share of the workforce, the escape route is closing faster than anyone can move through it.
Skills, Jobs and Employment
The U.S. Department of Labor maintains a database called O*NET that decomposes virtually every occupation in the American economy into the abilities and skills required to perform it. There are 52 abilities — things like Finger Dexterity, Deductive Reasoning, Stamina, Oral Comprehension — and 35 skills — things like Programming, Negotiation, Writing, Repairing. Together, these 87 variables form the building blocks of work.
Jobs are not stable units. They appear, merge, split, and vanish as the economy evolves. O*NET has revised its occupational titles four times since 2006 — adding occupations like Solar Photovoltaic Installer and Data Scientist, retiring others, merging roles that converged. But the underlying taxonomy of abilities and skills has remained essentially unchanged since it was first developed in the mid-1990s, drawing on decades of psychological research into human cognition and motor function. Jobs describe what the economy needs. The 87 skills and abilities describe what humans can do. And what humans can do hasn’t changed.
This distinction is the key to understanding why previous automation didn’t produce permanent mass unemployment. When the power loom displaced handloom weavers, it didn’t eliminate the need for Manual Dexterity or Coordination or Visual Attention. It eliminated specific jobs that used those skills. The displaced weavers found factory work, clerical work, service work — different jobs, built from many of the same underlying abilities. The economy creates new work not by inventing new human capabilities but by recombining existing skills into new occupations. The web developer uses Reading Comprehension, Critical Thinking, and Programming. The job might be new; the skills and abilities aren’t.
Now consider what changes when technology advances on the skills themselves. When AI reaches the 90th percentile on Reading Comprehension, it doesn’t displace one job — it shifts the competitive balance on a skill that is woven into hundreds of occupations simultaneously. The displaced paralegal, the redundant analyst, the automated copywriter — they all relied on the same underlying ability, and it is under pressure everywhere at once. The escape route that previous generations used — take your skills to a different industry — doesn’t work when the skill itself is what’s been matched.
Scoring Technology
So the question becomes: where does technology actually stand on each of these 87 skills? Not as a vague impression, but as a specific measurement, tracked over time.
For each skill, there are two distinct lines to track. The first is the state of the art — what the best AI or robotic system can achieve in real-world conditions, regardless of cost. Think Deep Blue beating Kasparov: a genuine demonstration of capability, but running on hardware that cost millions and could do nothing else.
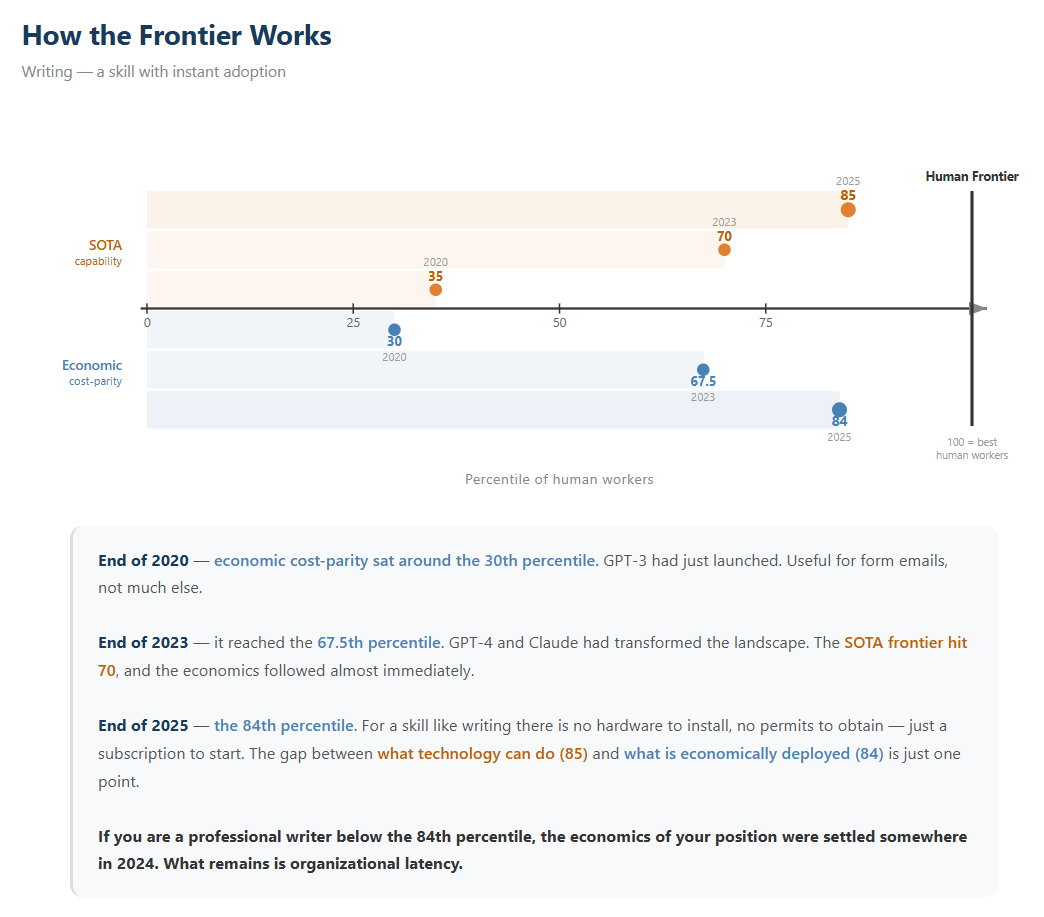
The second is economic cost-parity — the skill level technology can deliver at the same or lower total cost as a human worker. This is the line that matters for employment. When this line passes you on the percentile distribution, a rational employer can get your skill level for less money. Not every employer will act on this immediately — organizational inertia, regulation, and cultural resistance all create delays — but the economic logic is set. (A note on wages: these scores are calibrated against U.S. labor costs. For most of the world, wages are lower and cost-parity arrives later — but not much later. The cost of AI is falling so fast that the gap between U.S. and global cost-parity is measured in years, not decades. And for software-delivered skills, the marginal cost is already so close to zero that wage differences barely matter.)
Take Writing as an example. At end of 2020, economic cost-parity sat around the 40th percentile. GPT-3 had just launched. Useful for form emails, not much else. By end of 2023, it reached the 72nd percentile. By end of 2025: the 84th. For a skill like writing, there is no hardware to install, no permits to obtain — just a subscription to start. If you are a professional writer below the 84th percentile, the economics of your position were settled somewhere in 2024. What remains is organizational latency.
I scored all 87 skills this way, for three time points: end of 2020, end of 2023, and end of 2025. The raw data — benchmarks, hardware costs, deployment examples — is public. But two pieces of interpretation are required to turn that data into scores. First: for each skill, how do the most relevant benchmarks translate to a position on the human percentile distribution? A score of 85% on SWE-bench doesn’t directly tell you what percentile of human programmers that equates to — that requires judgment about task difficulty, real-world generalization, and the shape of the human distribution. Second: how long will adoption be delayed for each skill once cost parity is reached? A cleared cognitive skill with no hardware requirements deploys in months; a cleared physical skill requiring regulatory approval and capital investment may take a decade.
For both interpretations, two frontier AI models — Google’s Gemini 3.1 Pro and Anthropic’s Claude Opus 4.6 — independently produced detailed assessments for each variable. Each assessment was anchored to specific, named benchmarks: ARC-AGI for inductive reasoning, SWE-bench for programming, KITTI for spatial orientation, GSM8K for mathematical reasoning, and dozens more. Both models were instructed to apply a bearish bias — penalizing impressive lab results for real-world generalization failures, and accounting for hardware costs, maintenance, and liability in the economic scores. The resulting scores were averaged.
The irony’s not lost on me: I used AI to assess AI’s capabilities. The mitigation is threefold. Every score is anchored to publicly verifiable benchmarks, not to the model’s self-assessment. Two competing models from different companies assessed independently, providing a cross-check. And the systematic bearish bias means the scores are, if anything, conservative.
Anthropic published a labor market report this week using a different methodology — measuring actual Claude usage patterns against O*NET tasks — and their findings on which occupations are most exposed are broadly consistent with mine. Their approach is valuable as a ground-truth measurement of where AI is actually being used right now. This paper asks a different question: where is AI headed, how fast, and what does that mean for the structure of employment? The Anthropic study provides a snapshot; this paper provides a trajectory. Three dimensions are absent from their analysis that are central to mine: the longitudinal measurement (tracking capability across three time points to establish rate and acceleration), the framework for why Jevons paradox and the lump of labor fallacy may not apply (the two escape routes closing simultaneously), and the inclusion of physical, robotic, and sensory capabilities alongside purely cognitive AI — which their study, focused on Claude usage, necessarily cannot capture.
The full assessments are published alongside this article. To show how the reasoning works in practice, here are four examples.
Fluency of Ideas — economic cost-parity: 92nd percentile. Gemini’s assessment: when measured strictly on the volume of ideas produced, current AI operates at a superhuman level, generating thousands of variations in the time a human produces one. At fractions of a cent per API call, the economics aren’t close. The score isn’t 100 because sheer volume comes with noise — AI-generated ideas occasionally repeat, contradict, or drift incoherent, which a top-percentile human brainstormer would catch and avoid.
Written Expression — economic cost-parity: 83rd. With token generation costs near-zero compared to human hourly rates, the economic score tracks close to the raw capability. It falls short of 99 because elite writing — the kind that builds long-form strategic arguments, sustains a distinctive voice over tens of thousands of words, or surprises with genuine literary originality — remains beyond reliable reach.
Complex Problem Solving — economic cost-parity: 48th. Claude scored this conservatively: the generalization penalty bites hardest during implementation, where AI can generate plausible multi-step plans but cannot yet execute them across the physical, social, and political realities of an actual organization.
Finger Dexterity — economic cost-parity: 6th. The most advanced dexterous robotic hands can perform basic object reorientation under controlled conditions. In unstructured environments, they fail at tasks a five-year-old manages effortlessly. Hardware costs of $50k+ before maintenance keep cost-parity near zero.
Results: The Final Frontiers
Here is what the measurement shows.
Play with the interactive chart


Each spoke is one of the 87 skills and abilities. The dashed outer ring is the human frontier — the 100th percentile. The colored shapes show economic cost-parity: teal is 2020, green is 2023, orange is 2025.
Ethan Mollick and colleagues coined the term “jagged frontier” to describe how AI capability is unevenly distributed — superhuman at some tasks, incompetent at others. That concept is exactly right, and it’s visible here. But what the time dimension reveals is that the jagged frontier is not static. It is expanding, rapidly and on nearly all axes simultaneously.
The philosopher Nick Bostrom once described technology’s advance as sand being poured into a box representing all possible capabilities. How the sand falls determines what gets filled first, but eventually the box fills up. The demand for human skills at any moment equals the empty space remaining.
Look at how much sand has been added in just five years.
In 2020, on average, technology could economically outperform the worst 18% of professionals across the 87 skills. By 2025, this grew to 56%. The median score is 62. Technology is now cheaper than most people at most skills.
In 2020, technology outperformed the bottom quarter of professionals on only 29% of skills. Being mediocre was enough to be safe in nearly any job. By 2025, 84% of skills are past that line. Mediocrity is no longer a viable economic position on almost any dimension.
The rate is accelerating. Between 2020 and 2023, the average economic score rose 7.1 percentile points per year. Between 2023 and 2025: 8.4 points per year. At current pace, the average skill reaches full saturation in roughly five years.
At the state of the art — ignoring cost — the number of skills where a bottom-quartile worker still outperforms the best available system is down to four: Stamina, Gross Body Coordination, Finger Dexterity, and Dynamic Strength. Four out of eighty-seven. All of them require a physical body. The economic picture is slightly less extreme — cost still protects some workers that capability alone does not — but the direction is the same, and the gap between what AI can do and what it can do cheaply is closing fast.


Results — the jobs
People don’t sell skills. They sell jobs — integrated bundles where all 87 skills play some role, though only a subset matters enough to define the occupation. The O*NET database provides this mapping for 1,016 occupations: which skills matter, how much, and how demanding the job is on each one.
By joining the AI scores to these profiles, I can ask: for this specific job, what percentage of the required skill profile can technology already deliver at competitive cost? For each occupation, every important skill is scored by how far technology has come toward the level the job actually requires — capped at 100%, so that a saturated skill doesn’t compensate for an unsaturated one. These are weighted by importance and summed into a single percentage.
The range is narrower than you might expect. The most exposed occupation — Proofreaders and Copy Markers at 99.3% — is built almost entirely from cognitive skills where AI has already reached cost parity: reading comprehension, writing, information ordering. Payroll and Timekeeping Clerks sit at 97.8%, Statistical Assistants at 97.2%. The remaining gaps are thin — a sliver of judgment here, a licensing requirement there.


The safest occupations are Dancers (70.7%), Farmworkers (78.1%), and Structural Iron and Steel Workers (78.4%). Notice what they share: bodies. The bottleneck skills keeping these jobs human are multilimb coordination, stamina, spatial orientation in unstructured environments. This is Moravec’s paradox playing out in economic data — the skills that seem trivial to a five-year-old are the ones that technology finds hardest to replicate at any cost, let alone at cost parity with a human worker.


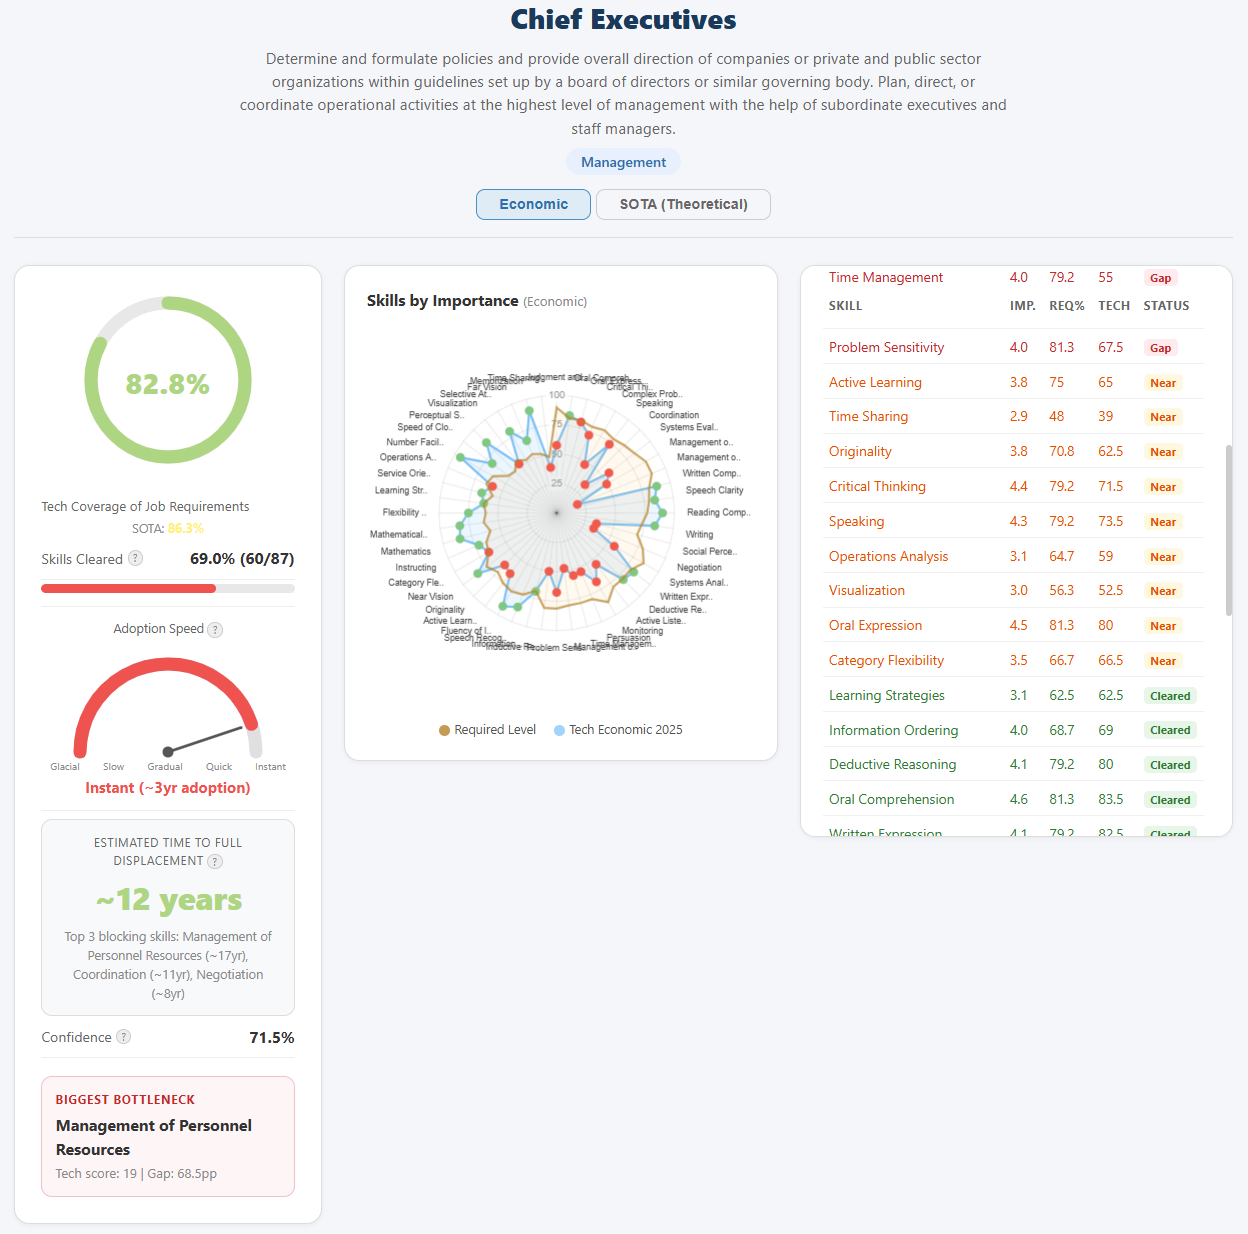
But look at the most common jobs. Retail Salespersons — 2.32% of the U.S. workforce — sit at 91.2%. General and Operations Managers (2.19%) at 91.4%. Baristas (2.23%) at 88.1%. Registered Nurses (2.00%) at 86.3%. These are the backbone of employment, and every one of them has more than 86% of its required skill profile already covered.


A natural reaction to these numbers is disbelief. If 91% of retail sales skills are covered, why do we still have retail workers? If AI can clear in a job where AI clears all but one important skill, but that last skill requires a human to be physically present, that job still needs the human for the entire shift. The cleared skills don’t disappear — they become the parts the human does faster with AI assistance. The job transforms rather than vanishes.
The real story is a three-phase sequence.
Phase one: AI clears most skills in a job. Humans become more productive. Fewer are needed to produce the same output. Hiring slows — which is exactly what Anthropic found in their March 2026 labor market report: a roughly 14% drop in the rate at which workers aged 22–25 entered highly exposed occupations. Not mass layoffs. A quiet thinning of the pipeline.
Phase two: Organizations restructure around the bottleneck. The completed skills are reassigned to AI, human roles shrink, headcount drops even as job titles persist.
Phase three: The bottleneck skills themselves are cleared, and the job disappears.
Most jobs are in phase one right now. The completion percentage tells you how deep into phase one they are, and how close phase two is. It doesn’t tell you when phase three arrives — that depends on the bottleneck, and some bottlenecks could take decades. The completion percentage is a measure of economic pressure, not a countdown timer. A job at 90% is under enormous pressure to restructure. A job at 70% is under moderate pressure. But neither is “90% automated” in the sense people intuitively imagine. What the number captures is the share of the skill profile where the economic argument for the human is already gone. What remains is organizational inertia, regulatory friction, and the specific bottleneck skills that haven’t been cleared.
Adoption
A self-driving taxi that is cheaper per mile than a human driver doesn’t displace anyone until regulators approve it, insurers underwrite it, and ride-hailing companies restructure their operations around it. The technology exists. The economics work. But the taxi driver still has a job — because the institutions haven’t caught up. Everything above measures what technology can do at competitive cost. This section is about how quickly that translates into what technology actually does.
I categorized each of the 87 skills into five adoption tiers based on how quickly cost-competitive AI translates into real-world deployment.
Instant (14 skills, average economic score: 84). Pure software capabilities with essentially no deployment barrier. Writing, Fluency of Ideas, Reading Comprehension, Information Ordering. If you have an internet connection, you already have access. There is no hardware to install, no permit to obtain, no organizational restructuring required — just a subscription. For these skills, the economic score is the deployment story.
Quickly (32 skills, average economic score: 67). Minor workflow changes or integration needed. Programming, Data Analysis, Critical Thinking. Companies need to adjust processes and build tooling, but the barriers are months, not years.
Gradually (18 skills, average economic score: 55). Moderate barriers — regulation, change management, trust-building. Skills like Judgment and Decision Making or Management of Financial Resources, where organizations need to validate AI reliability before handing over responsibility.
Slowly (23 skills, average economic score: 25). Significant infrastructure, regulatory buildout, or physical deployment required. Operations Monitoring, Equipment Maintenance, Finger Dexterity — skills where physical systems, safety-critical environments, union agreements, or licensing regimes slow deployment considerably. This tier now includes all physical and embodied skills; no skill in the dataset requires more than a decade of post-clearance deployment time.
The pattern is stark. The skills where AI is strongest are the same skills where adoption is fastest. Cognitive, software-deliverable skills score high on capability and face minimal friction. Physical and trust-dependent skills score low on both. There is no large category of skills where AI is highly capable but deployment is blocked — the comforting scenario where regulation or culture provides a durable shield.
If in your job AI is already economically viable but adoption barriers — regulatory, organizational, cultural — have not yet cleared, your profession is on borrowed time. Like the taxi driver: the skill profile is largely covered, the economics favor automation, and once the regulatory gate opens, uptake will be rapid. But borrowed time is not limited to physical jobs. A billing clerk whose role is 96% covered by skills in the Instant and Quickly tiers faces no meaningful adoption barrier at all. What protects her is that her employer hasn’t reorganized yet. Recall the three-phase sequence: most jobs are in phase one, where AI has cleared most skills and hiring is slowing. Borrowed-time jobs are the ones where phase one is already well advanced, and the only thing separating them from phase two — organizational restructuring, headcount reduction — is inertia.
The question this naturally raises — how long does any given job actually have? — requires combining the skill scores, the adoption tiers, and the rate of progress into a single per-occupation estimate. That is the subject of the next section.
How long does your job have?
The previous sections established how far AI has come on each skill, how much of each job’s profile is already covered, and how quickly capability translates into deployment. This section combines all three into a single estimate per occupation: how many years until the job is fully displaced?
I built an interactive tool where you can search any of the 1,016 occupations in the O*NET database, see its full skill profile, and get this estimate. You can find it at [LINK]. Look up your own job. Then challenge the number.
The method.
For each occupation, I identify every skill that is still blocking full displacement — either because AI hasn’t reached the job’s required level, or because it has but adoption hasn’t followed. For uncleared skills, I divide the remaining gap by a per-skill projected progress rate — estimated by the AI assessors based on observed trajectory, investment trends, and innovation context for that specific capability — and then take the longer of either that time-to-clearance or the adoption lag, since technology development and deployment infrastructure advance in parallel. For cleared-but-not-yet-adopted skills, the remaining time is simply the adoption lag minus the years since clearance.
The estimate is then built from the three hardest remaining blockers — the skills with the longest time left — combined as an importance-weighted average:
T = Σ(importance × time_left) / Σ(importance) for the top 3 blocking skills
Why the top 3? Because a single bottleneck invites restructuring — if 24 of 25 skills are cleared, the economic pressure to redesign the job around the last one is immense. But three important, long-horizon blockers are genuinely hard to restructure away from. The importance weighting ensures that marginal skills can’t inflate the estimate: a skill at importance 2.5 contributes far less than one at 4.5.
When will you be retired? Check the job explorer
A few examples. Proofreaders: 3.5 years — virtually every skill is cleared, the remaining time is pure adoption lag. Registered Nurses: 12.3 years — the blocking skills are physical (stamina, finger and manual dexterity) and sit in slow adoption tiers, but the profession will look radically different well within a generation. Structural Iron and Steel Workers: 14.2 years — multiple high-importance physical skills, all far from solved. This is what genuine resilience looks like in the data. The longest estimate in the database is Dancers at 17.4 years. If these estimates hold, the backbone of the 2035 U.S. labor market is steel workers, farmers, and dancers.
What this demands
The standard response to concerns about AI and employment is the lump of labor fallacy — the argument this article opened with. Technology displaces workers, but it also creates new industries, new roles, new forms of work that nobody anticipated. This has always been true. But the mechanism by which it was true depended on two escape routes that are now both closing.
The first escape route was moving to a different context for the same skill. A power loom conquered weaving, but it didn’t conquer Manual Dexterity as a human ability — it conquered one specific application of that ability. The displaced weaver’s hands were still valuable in hundreds of other jobs. Previous technologies were narrow: they replaced a skill in a context. AI replaces the skill itself. When AI reaches the 84th percentile on Writing, it doesn’t displace one kind of writer — it shifts the competitive balance on a skill woven into hundreds of occupations simultaneously. A displaced legal writer cannot retrain into marketing, because the same skill under pressure in law is under equal pressure in marketing. There is no industry where that skill is safe, because the skill is the same everywhere.
The second escape route was moving to a different skill entirely. When machines took muscle, humans moved to cognition. When computers took calculation, humans moved to judgment and communication. There was always a neighboring category of skills that technology hadn’t reached. What this dataset shows is that AI is advancing on nearly all 87 skills in parallel. The frontier of uncontested skills is not shifting — it is shrinking.
The lump of labor fallacy stops being a fallacy when both escape routes are closed — when skills are contested everywhere they appear, and there are too few uncontested skills left to build new jobs from. And the Jevons paradox stops working when the resource being made cheaper is human labor itself: making workers more productive with AI does increase demand in the short run, but it also trains the replacement. Every efficiency gain that uses AI to augment a human is a proof of concept for removing the human entirely.
Won’t people be augmented by AI rather than replaced? Garry Kasparov argued this after losing to Deep Blue in 1997 — that human-AI teams, which he called centaurs, would outperform either alone. And he was right. For a few years. Then AI alone surpassed any human-AI team. In Go, the centaur phase was barely a thing — it was measured in months rather than years. Human-AI collaboration is real, it is valuable, and it is a transition state, not a destination.
If the completion conjecture holds and all 87 skills are eventually saturated, the only remaining economic argument for hiring a human would be the value of biological humanity itself. Call it skill 88: being human. It is not measured in this framework, but it is likely real — people may prefer a human therapist, a human teacher, a human waiter, for reasons that have nothing to do with competence or cost. Some jobs will survive on that basis. But if that is the last holdout, labor markets will restructure to circumvent it sooner than you might think. An employer facing a 10× cost difference does not pay for the human option forever. Cultural preferences erode under sufficient economic pressure.
Consider what full saturation means. It means the end of labor as a relevant factor of production. Not a reduction in labor’s share — its elimination. Every economic system since the agricultural revolution has been built on the assumption that most people have something to sell: their time, their effort, their skill. The wage is not just an income — it is the mechanism by which the vast majority of humans access the wealth that the economy produces. When that mechanism breaks, it doesn’t fix itself.
The historical balance of power between capital and labor has always rested on a simple fact: capital needs workers. That need created unions, labor laws, safety standards, minimum wages — not the goodwill of employers, but the bargaining power that comes from being necessary. Kulveit et al. describe this as gradual disempowerment: as AI replaces human participation in economic systems, the implicit alignment between those systems and human interests breaks down, because that alignment was only ever maintained by the necessity of human labor. Drago and Laine call it the intelligence curse: when powerful actors can generate wealth through AI rather than people, they lose the economic incentive to invest in people at all — just as resource-rich rentier states neglect their citizens because their revenue comes from oil rather than taxes on labor.
Both frameworks point to the same conclusion: the win-win between economic elites and working people — where growth enriches both because both are needed — is ending. What replaces it is not a negotiation. It is a choice made by those who own the capital.
This is not a thought experiment. It is a trajectory visible in the data published alongside this article, advancing at 8.4 percentile points per year. The battle over the ownership of the means of production is not a 20th-century relic. It is the defining economic question of the next decade. And it is a battle that is already lost if we only start fighting it when the window is closed and the skill box is completely filled.
The full dataset — all 87 skill assessments, the per-occupation profiles, the interactive visualization, and the static prediction data — is published alongside this article. I want this to be challenged, refined, and built upon. If you think a score is wrong, say so. If you have better data, share it.
The interactive visualization is at https://daity.tech/frontier.html. The job explorer is available at https://daity.tech/jobexplorer.html. I can be reached at gert@sustainer.nl.
References
Anthropic / Massenkoff & McCrory — “Labor market impacts of AI: A new measure and early evidence” (March 5, 2026)
Bostrom, Nick — The Future of Humanity (2009). Technological completion conjecture.
Drago, Luke & Rudolf Laine — “The Intelligence Curse” (April 2025). intelligence-curse.ai
Jevons, William Stanley — The Coal Question (1865). The Jevons paradox.
Kulveit, Jan et al. — “Gradual Disempowerment: Systemic Existential Risks from Incremental AI Development” (January 2025). arXiv:2501.16946. ICML 2025.
Mollick, Ethan et al. — “The Shape of AI: Jaggedness, Bottlenecks and Salients” (December 2025)
Moravec, Hans — Mind Children (1988). Moravec’s paradox.
Tinbergen, Jan — Income Distribution: Analysis and Policies (1975). “The race between technology and education.”
O*NET — Occupational Information Network, U.S. Department of Labor. onetcenter.org
Appendix / linked materials
Full 87-variable assessments from Gemini 3.1 Pro and Claude Opus 4.6
Static prediction data (time-left estimates per occupation, dated March 2026)
Discussion
On capped completion scores. The per-occupation completion percentages reported in this article are capped at 100% per skill — if AI exceeds the job’s required level on a given skill, that skill scores 100%, not higher. This is conservative by design: it prevents a skill where AI wildly over-delivers from masking a gap elsewhere. But it also means the headline percentages understate AI’s total capability relative to the job. Many occupations have uncapped scores well above 100% — meaning AI over-delivers on some skills while still having gaps on others. The uncapped scores are available in the published dataset.
On wages and global applicability. The economic cost-parity scores are calibrated against U.S. labor costs, which are among the highest in the world. This means the percentile at which AI becomes cheaper than a human worker is lower in countries with lower wages — a skill that reaches cost parity at the 56th percentile in the U.S. might not reach it until the 35th percentile in Bangladesh. However, for software-delivered skills (the Instant and Quickly tiers), the marginal cost of AI is already so close to zero that wage differentials barely matter. A $20/month AI subscription undercuts human labor at virtually any wage level. The physical and slowly-adopted skills are where wage differences create meaningful geographic variation in timelines. A fuller treatment of global cost-parity is left for future work.
What would change my mind. Two things could break this argument. The first is generalization. Every score in this dataset is anchored to benchmarks — structured tests designed to measure specific capabilities. The implicit assumption is that benchmark performance predicts real-world performance in novel contexts. If that assumption is weaker than we think — if overfitting and benchmark saturation are more pervasive than current evidence suggests — then the scores systematically overstate what AI can actually do when deployed. The leading AI researchers who disagree on timelines are largely disagreeing about this: not about whether models will keep scaling, but about whether scaling translates to robust, generalizable competence or merely to increasingly impressive performance on increasingly familiar test formats. If the generalization penalty turns out to be far harsher than I’ve estimated, the timeline stretches dramatically, and the frontier is further away than this data implies.
The second is the gap between verifiable and unverifiable domains. AI progress has been fastest where outputs can be automatically checked — mathematics, coding, games, pattern recognition. Progress has been slower where verification requires human judgment — management, persuasion, complex problem solving in ambiguous environments. This might not mean AI hits a ceiling in those domains, but it could mean that trustworthy, adoptable performance takes decades longer than the raw capability scores suggest. If organizations cannot verify that AI judgment is reliable without extensive human oversight, the effective cost-parity shifts far to the right — the technology might be capable, but not trustworthy enough to deploy without supervision that erases the cost advantage. Either of these would not invalidate the direction of the argument — the frontier is still closing — but they would substantially extend the timeline. Instead of five years to average saturation, it might be fifteen or twenty. That is a meaningful difference for policy: it is the difference between a crisis that arrives before institutions can respond and one that allows time for preparation.
Full time-left estimation methodology
Scope. For each of 1,016 ONET occupations, the model estimates years until full AI displacement. Only skills with ONET importance ≥ 2.5 are included.
Inputs per skill.
economic_2020, economic_2023, economic_2025: AI cost-parity percentile at each time point (0–100)
required_percentile: O*NET level converted to percentile — the minimum competency the job demands
projected_annual_rate: assessor-estimated percentile points of progress per year, based on observed trajectory and innovation context
adoption_years: post-clearance deployment lag (Instant=1, Quickly=3, Gradually=5, Slowly=10)
Step 1: Classify each skill.
A skill is cleared if economic_2025 ≥ required_percentile. For cleared skills, interpolate when clearance occurred:
If economic_2020 ≥ required: cleared ≥ 5 years ago
If economic_2023 ≥ required: cleared 2–5 years ago, linearly interpolated
Else: cleared 0–2 years ago, linearly interpolated
If years_since_cleared ≥ adoption_years, the skill is fully done and excluded from the estimate. Otherwise it is cleared but not yet adopted.
An uncleared skill is one where economic_2025 < required_percentile.
Step 2: Compute time_left per skill.
For cleared-but-not-yet-adopted skills:
time_left = adoption_years − years_since_cleared
For uncleared skills:
gap = required_percentile − economic_2025
time_to_clear = gap / projected_annual_rate
time_left = max(time_to_clear, adoption_years) + 2
The max rather than sum reflects that technology development and adoption infrastructure advance in parallel. The +2 is a minimum post-clearance friction floor (procurement, piloting, organizational change).
Fallback: if projected_annual_rate is missing or ≤ 0, use max((economic_2025 − economic_2023) / 2, 0.5).
Step 3: Combine into occupation estimate.
Sort remaining blocking skills by time_left descending. Take the top 3. Compute the importance-weighted average:
T = Σ(importance_i × time_left_i) / Σ(importance_i) for i in top 3
If fewer than 3 skills remain, use the same formula with a 2-year floor per skill. If 0 skills remain, T = 0.
T is capped at 30 years for display.
Why top 3, not top 1. A single bottleneck skill invites restructuring — the job gets redesigned around it. Three important blockers are harder to restructure away from. The importance weighting prevents marginal skills (importance 2.5) from inflating the estimate relative to core skills (importance 4.5).
Key assumptions.
Progress rate per skill. Each skill’s projected rate was estimated by two AI assessors (Gemini 2.5 Pro, Claude Opus 4.6) based on observed 2020–2025 trajectory, R&D investment trends, adjacent breakthroughs, and data scalability for that domain. Rates are bearish on current capability but aim for forecast accuracy on trajectory. Mean projected rate: 5.5 pts/year. Range: 1.5–10.0.
Parallel development. Technology clearance and adoption infrastructure are modeled as concurrent, not sequential. This avoids double-counting for physical skills where the same hardware and regulatory barriers slow both progress and deployment.
No correlated breakthroughs. Each skill is treated independently. In practice, a single robotics breakthrough could clear multiple physical skills simultaneously, making estimates conservative for skill clusters.
No job restructuring. The model assumes each job persists in its current O*NET form until all blocking skills are cleared. In reality, phase-two restructuring eliminates jobs before full skill clearance — making estimates conservative for when job titles disappear.
Constant progress rate. Each skill’s projected rate is held constant. Given that observed rates accelerated from 2020–2023 to 2023–2025, this is conservative. If progress continues to accelerate, timelines shorten.
U.S. labor costs. Cost-parity is calibrated against U.S. wages. For lower-wage economies, cost-parity arrives later for physical skills but is nearly identical for software-delivered skills.